SMART FACTORY · CASE STUDY 01
Piston Defect Intelligence System
An end-to-end quality data system that replaced paper records with barcode traceability, live dashboards, and near-real-time critical defect alerts.
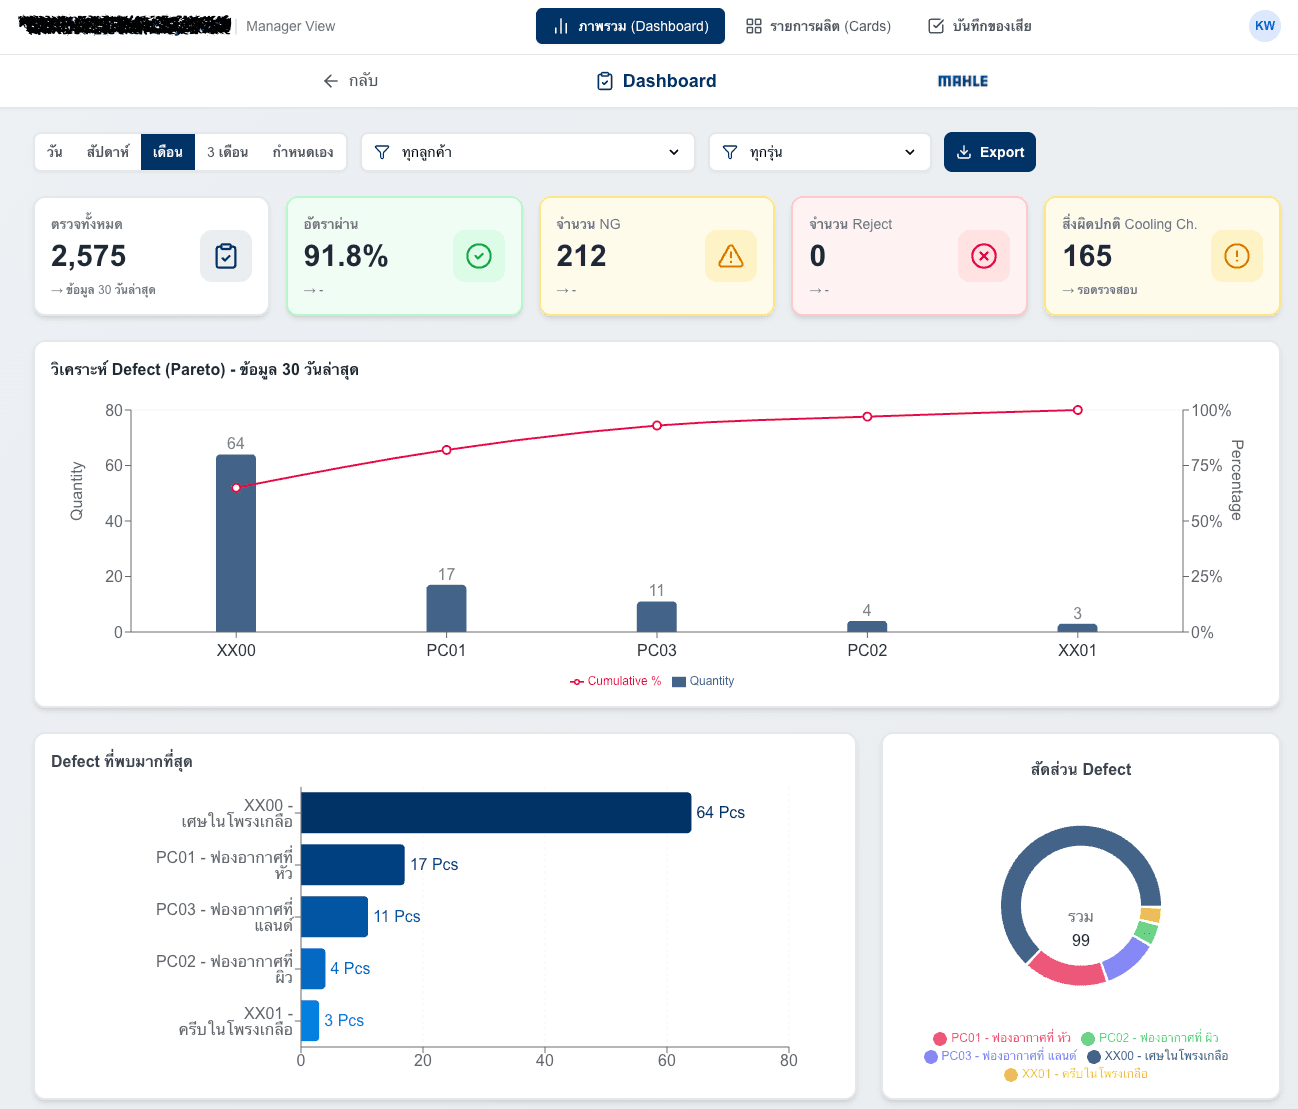
The problem behind the interface.
Production teams needed a faster and more reliable way to record, trace, and respond to piston defects. I translated the shop-floor workflow into a digital system: barcode-based logging for operators, PostgreSQL-backed traceability, live quality visualization, role-based access, and automated alert delivery for critical events.
What I owned,
not only what the team shipped.
Responsibilities are written as decisions and deliverables so the individual contribution stays visible.
Translated the real inspection workflow into system requirements and operator interactions.
Designed the data model, application flow, role-based access, and barcode traceability.
Connected database events to Edge Functions and webhooks for critical-defect alerts.
Carried the system from requirements and implementation through CI/CD and production use.
From raw signal
to useful response.
A simplified architecture showing how information changes as it moves through the system.
Capture
Barcode and inspection input
→Structure
PostgreSQL traceability record
→Observe
Live quality dashboard
→Respond
Critical event and alert
Designed around
the real constraint.
Features matter here because each one answers a workflow, data, or operational constraint.
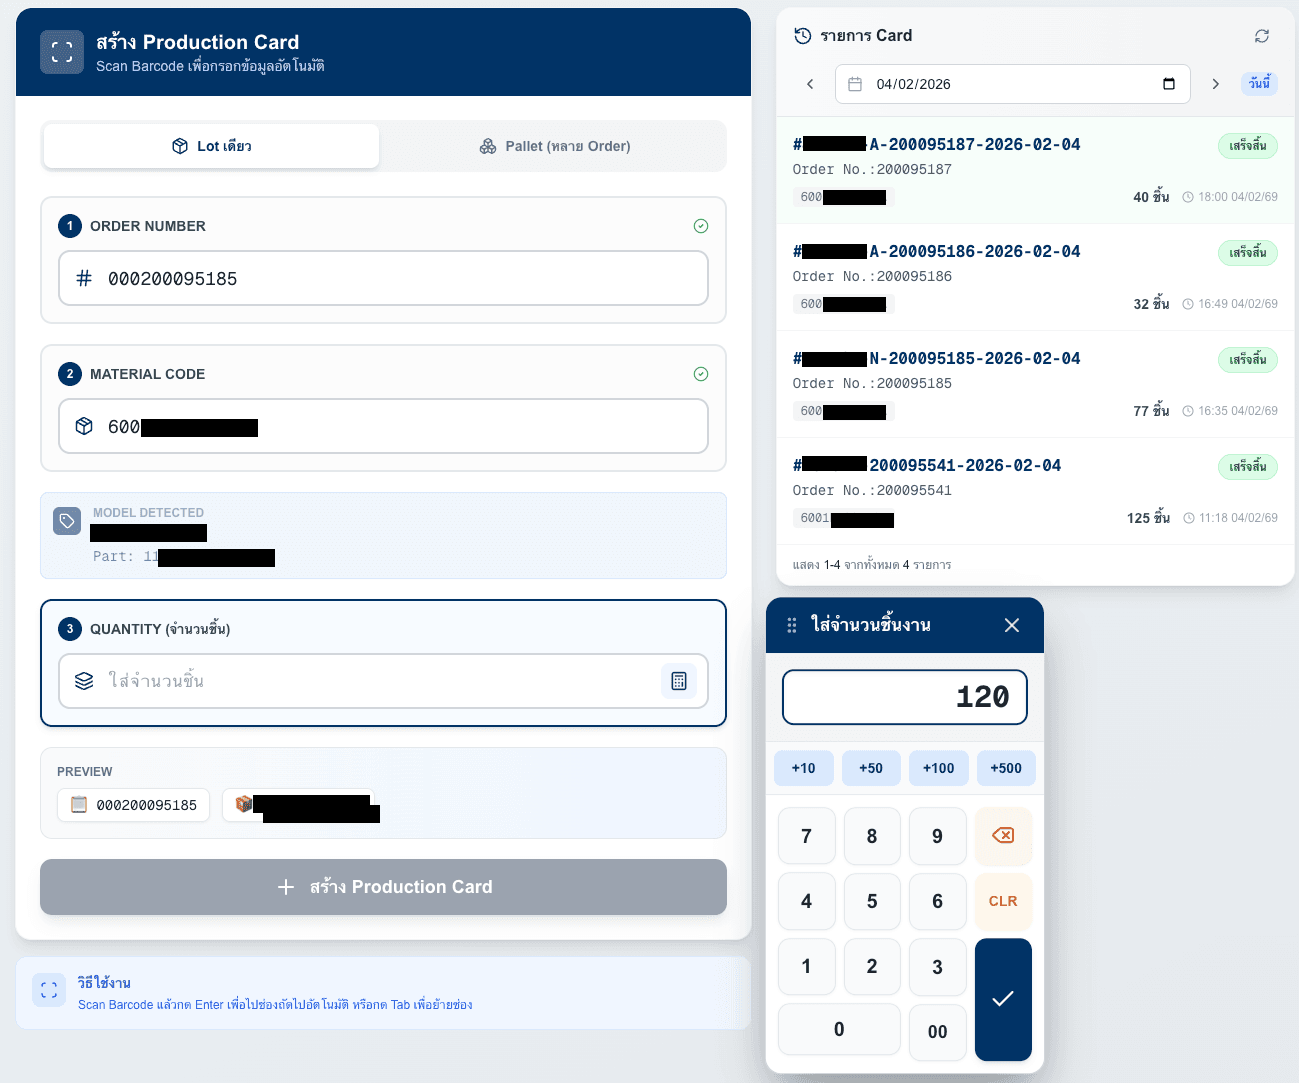
Digital defect logging and traceability
Replaced paper logs with a barcode-integrated workflow designed around production cards and operator speed.
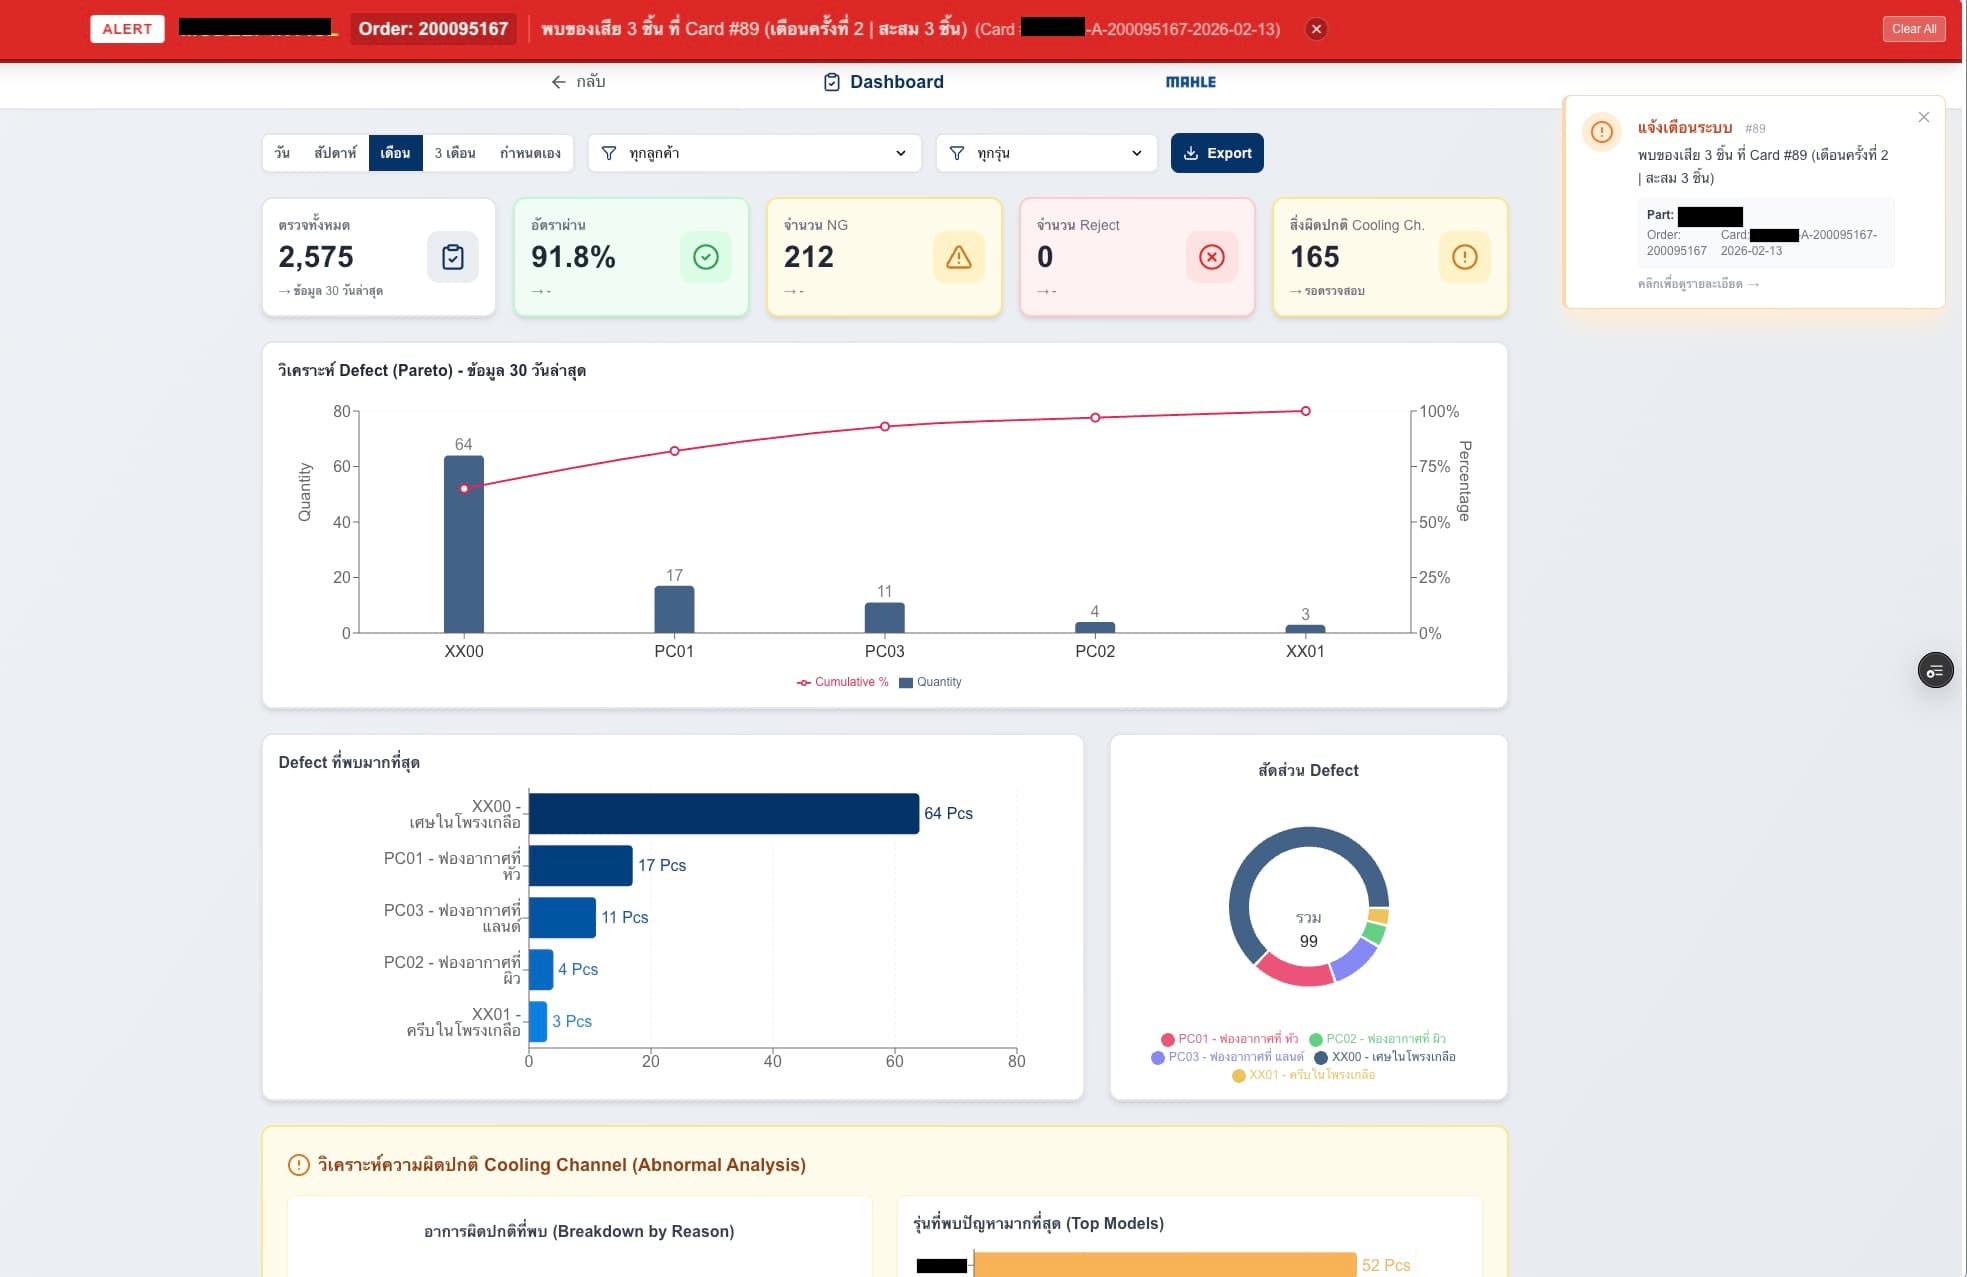
Critical defect notification
Used database events, Edge Functions, and webhooks to alert line leaders in under 500ms when critical defects were logged.
Live production dashboard
Made quality trends and bottlenecks visible to production teams without waiting for manual reports.
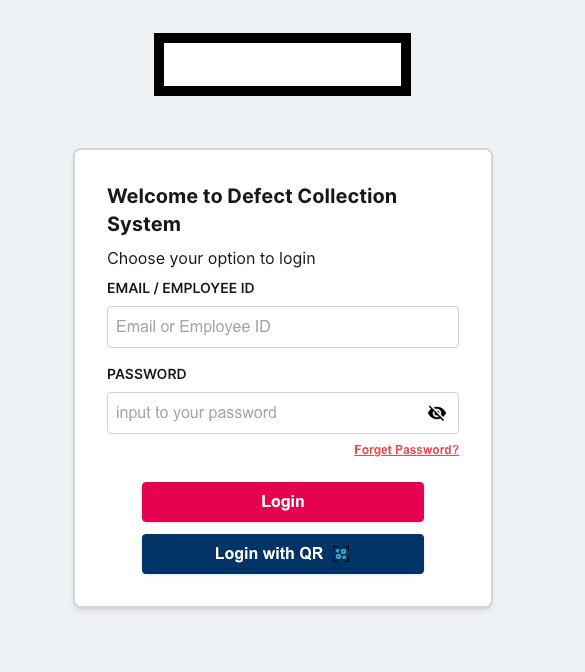
Fast, role-aware access
Combined role-based access with QR token login so operators could switch stations in under two seconds.
What can be claimed.
What still needs proof.
Useful engineering separates observed evidence from interpretation and future validation.
QR token login reduced operator switching friction.
Critical events reached the notification workflow in near real time.
Requirements, data, interface, automation, and deployment were handled as one system.
Known limitations
- The system depends on disciplined production-card and barcode usage at the source.
- Alert speed is observable, but the long-term effect on defect escape and response behavior still needs a larger operating window.
Next engineering steps
- Connect inspection records with machine and process parameters for root-cause analysis.
- Add explicit data-quality monitoring and alert-delivery observability.