SUPER AI S6 · MINI-HACKATHON 01
Domestic Violence Analytics Dashboard
An insight-led analytics dashboard that turns 877 domestic-violence records into an explainable view of risk factors, affected groups, locations, time patterns, and policy priorities.
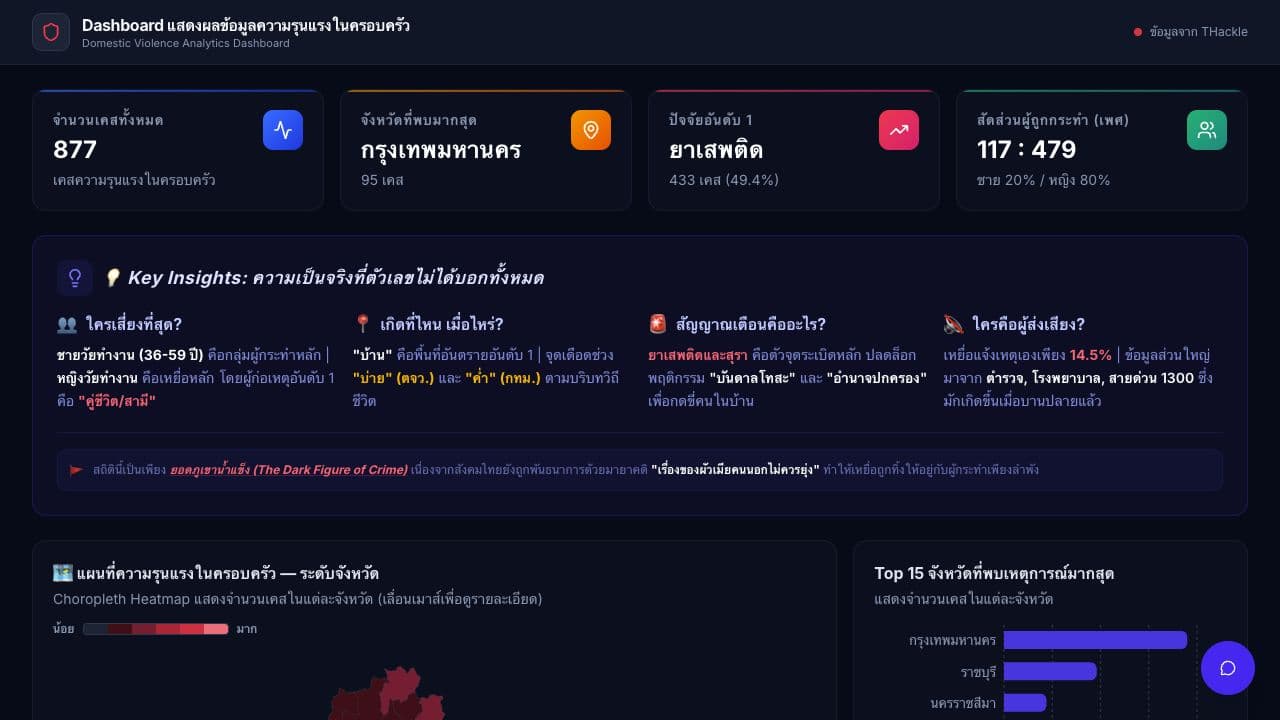
The problem behind the interface.
The hackathon challenge was to move beyond charting a sensitive social dataset and find the patterns that decision-makers could act on. I explored and structured the supplied THackle data, examined geographic, demographic, relationship, time, and reporting dimensions, then translated the findings into a narrative dashboard that makes both the signals and the dataset's limitations visible.
What I owned,
not only what the team shipped.
Responsibilities are written as decisions and deliverables so the individual contribution stays visible.
Cleaned and normalized analytical dimensions across location, age, relationship, factor, place, and time.
Explored connected demographic, geographic, behavioral, and reporting patterns.
Designed the dashboard narrative around four decision-oriented questions rather than isolated charts.
Kept under-reporting and interpretation limits visible alongside the policy recommendations.
From raw signal
to useful response.
A simplified architecture showing how information changes as it moves through the system.
Audit
Inspect categories and missing context
→Engineer
Normalize and derive dimensions
→Explore
EDA across connected signals
→Explain
Insight and policy narrative
Designed around
the real constraint.
Features matter here because each one answers a workflow, data, or operational constraint.
From raw records to analysis-ready dimensions
Structured the supplied records into comparable dimensions for location, age, gender, relationship, contributing factors, reporting channel, place, and time of incident.
Exploratory analysis across connected signals
Compared geographic, demographic, behavioral, and temporal patterns instead of treating each chart as an isolated statistic.
Insight-first dashboard storytelling
Designed the dashboard around four questions - who is at risk, where and when incidents occur, what warning signals appear, and who is able to report them.
Policy framing with visible limitations
Connected the findings to actionable policy directions while explicitly highlighting under-reporting and the dark-figure-of-crime limitation.
What can be claimed.
What still needs proof.
Useful engineering separates observed evidence from interpretation and future validation.
The complete supplied case set was explored across multiple dimensions.
Geographic, factor, age, relationship, source, place, time, and gender views were connected.
The story was organized around risk, place and time, warning signals, and reporting behavior.
Known limitations
- Reported cases represent only observed records and cannot describe the full prevalence of domestic violence.
- Associations in the data should not be interpreted as causal relationships.
- Differences in reporting channels and local practices may affect geographic comparisons.
Next engineering steps
- Publish a reproducible data dictionary and transformation log.
- Add sensitivity checks for missing values and category definitions.
- Validate proposed policy indicators with domain experts and frontline organizations.